

Class: Primary 5
Term: 3rd Term
Week: 10
Age: 10 years
Duration: 45 minutes
Subject: General Mathematics
Curriculum Theme: Probability
Previous Lesson: Measurement of Central Tendency, Median, Ordering Data and Finding Middle Value.
Topic: TOSSING COINS AND THROWING DICE.
Subject Matter: Tossing coins and recording heads and tails, throwing dice and recording outcomes, preparing tally from results, identifying chance events in daily life activities, quantitative aptitude on chance events.
Specific Objectives
By the end of the lesson, pupils should be able to:
Cognitive Domain:
Instructional Materials
The teacher will teach this lesson with the aid of:
- A coin (e.g., ₦1 or ₦2 coin).
- A standard six-sided die.
- Chart showing examples of tally tables.
- Flash cards with terms like ‘Head’, ‘Tail’, ‘Die’, ‘Chance’.
- Posters illustrating daily life chance events.
- Quantitative aptitude workbook for Primary 5.
Rationale for the Lesson
This lesson helps pupils understand how to record outcomes from simple chance experiments like tossing coins and throwing dice. It enables pupils to see how random events occur and how to organize data from them, which is important for understanding real-life situations involving uncertainty.
Prerequisite/Previous Knowledge
Pupils should have basic knowledge of counting, number recognition up to 6, and simple data representation.
Lesson Content/Board Summary
Tossing Coins and Throwing Dice: Chance Events
Tossing Coins and Recording Outcomes
Tossing a coin is a simple experiment with two possible outcomes: a Head (H) or a Tail (T). When a coin is tossed, we record which side lands face up.
Example: If a coin is tossed 5 times, the outcomes could be H, T, H, H, T.
Throwing Dice and Recording Outcomes
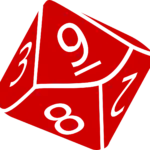
A die (plural: dice) is a small cube with six faces, each marked with a different number of spots from 1 to 6. When a die is thrown, one of these numbers will land face up.
Example: If a die is thrown 4 times, the outcomes could be 3, 5, 1, 6.
Preparing Tally from Results
A tally chart is a way to record and count data using tally marks. Each mark represents one occurrence, and every fifth mark is drawn diagonally across the previous four to make a bundle of five.
Steps to prepare a tally chart:
- Draw a table with columns for ‘Outcome’, ‘Tally’, and ‘Frequency’.
- For each outcome, draw a vertical line (|) in the ‘Tally’ column.
- For the fifth occurrence, draw a diagonal line across the previous four (
||||). - Count the tally marks for each outcome and write the total in the ‘Frequency’ column.
Example 1: Coin Toss (10 tosses)
| Outcome | Tally | Frequency |
|---|---|---|
| Head (H) | 6 | |
| Tail (T) | |||| | 4 |
Example 2: Die Throw (12 throws)
| Outcome | Tally | Frequency |
|---|---|---|
| 1 | || | 2 |
| 2 | | | 1 |
| 3 | ||| | 3 |
| 4 | 5 | |
| 5 | | | 1 |
| 6 | 0 | 0 |
Identifying Chance Events in Daily Life Activities
A chance event is something that might happen, but we cannot be certain of its outcome. It involves an element of randomness.
The following are examples of chance events in daily life:
- The weather tomorrow (will it rain or be sunny?).
- Winning a raffle draw.
- Which team will win a football match.
- Getting a flat tyre while driving.
- Picking a specific coloured marble from a bag without looking.
Quantitative Aptitude on Chance Events (Basic Probability)
Probability is the measure of how likely an event is to happen. It is calculated as:
Probability (Event) = (Number of favourable outcomes) / (Total number of possible outcomes)
Example 1: What is the probability of getting a Head when tossing a fair coin?
Solution:
Step 1: Identify total possible outcomes. (Head, Tail) = 2 outcomes.
Step 2: Identify favourable outcomes for getting a Head. (Head) = 1 outcome.
Step 3: Apply the probability formula.
Probability (Head) = 1 / 2
Example 2: What is the probability of throwing a ‘4’ when rolling a standard die?
Solution:
Step 1: Identify total possible outcomes. (1, 2, 3, 4, 5, 6) = 6 outcomes.
Step 2: Identify favourable outcomes for throwing a ‘4’. (4) = 1 outcome.
Step 3: Apply the probability formula.
Probability (4) = 1 / 6
Teaching Methods/Instructional Techniques
Discussion, Lecture, Demonstration, Question and Answer, Visual Aids
Instructional Procedures
Step 1: Introduction
Time: 5 minutes
Teaching Skill: Set Induction
Teacher’s Activity: The teacher greets the pupils and asks them if they have ever played games involving coins or dice. The teacher then introduces the topic by explaining that today’s lesson will be about understanding how to record outcomes from tossing coins and throwing dice, which are simple chance events.
Pupils’ Activity: Pupils respond to the teacher’s questions and listen attentively to the introduction.
Learning Point: Pupils are introduced to the concept of chance events and the lesson’s relevance.
Step 2: Tossing Coins and Recording
Time: 7 minutes
Teaching Skill: Demonstration/Practical Activity
Teacher’s Activity: The teacher demonstrates how to toss a coin and identifies the outcomes (Head or Tail). The teacher then guides pupils to toss a coin 20 times individually or in pairs, recording each outcome (H or T) on a sheet of paper.
Pupils’ Activity: Pupils observe the teacher’s demonstration, then actively participate in tossing coins and recording their results.
Learning Point: Pupils learn to practically toss a coin and accurately record the outcomes.
Step 3: Throwing Dice and Recording
Time: 7 minutes
Teaching Skill: Demonstration/Practical Activity
Teacher’s Activity: The teacher demonstrates how to throw a die and identifies the possible outcomes (numbers 1 to 6). The teacher then guides pupils to throw a die multiple times (e.g., 12 times) individually or in pairs, recording each number that lands face up.
Pupils’ Activity: Pupils observe the teacher’s demonstration, then actively participate in throwing dice and recording their results.
Learning Point: Pupils learn to practically throw a die and accurately record the outcomes.
Step 4: Preparing Tally from Results
Time: 8 minutes
Teaching Skill: Explanation/Modelling
Teacher’s Activity: The teacher explains what a tally chart is and demonstrates how to prepare a tally table using the recorded results from the coin tosses and die throws on the board or a chart. The teacher guides pupils to prepare their own tally tables from their recorded data.
Pupils’ Activity: Pupils listen to the explanation, observe the demonstration, and then create tally tables for their coin and die experiment results.
Learning Point: Pupils learn how to organize raw data into a tally chart.
Step 5: Identifying Chance Events in Daily Life
Time: 5 minutes
Teaching Skill: Discussion/Questioning
Teacher’s Activity: The teacher defines “chance event” and provides examples of chance events in daily life using the poster. The teacher then asks pupils to mention other examples of chance events they encounter.
Pupils’ Activity: Pupils listen to the definition and examples, then contribute their own examples of chance events.
Learning Point: Pupils understand the concept of chance events and can identify them in real-life situations.
Step 6: Quantitative Aptitude on Chance Events
Time: 8 minutes
Teaching Skill: Explanation/Problem Solving
Teacher’s Activity: The teacher explains the basic formula for probability (favourable outcomes / total outcomes) and works through the examples provided in the lesson content on the board. The teacher then gives pupils one or two simple problems to solve from their quantitative aptitude workbook or on the board.
Pupils’ Activity: Pupils listen to the explanation, observe the solved examples, and attempt to solve the given problems.
Learning Point: Pupils learn to calculate simple probabilities for chance events.
Step 7: Evaluation/Review
Time: 5 minutes
Teaching Skill: Questioning/Assessment
Teacher’s Activity: The teacher evaluates the learning by asking the following questions:
- What are the two possible outcomes when tossing a coin?
- List all possible outcomes when throwing a single die.
- Explain how to make a tally mark for the fifth occurrence in a tally chart.
- Mention two examples of chance events in daily life.
- If a bag contains 3 red balls and 2 blue balls, what is the probability of picking a red ball?
Pupils’ Activity: Pupils answer orally and in writing.
Learning Point: Pupils demonstrate understanding of the lesson.
Step 8: Conclusion
Time: 3 minutes
Teaching Skill: Summarization
Teacher’s Activity: The teacher summarizes the key points of the lesson, emphasizing how to record outcomes, prepare tally tables, and identify chance events. The teacher then assigns homework related to recording outcomes and preparing tally charts from a simple experiment at home.
Pupils’ Activity: Pupils listen to the summary and copy down the homework.
Learning Point: Pupils consolidate their understanding of the lesson and are given follow-up tasks.
Home Task: Solve three new exercises on TOSSING COINS AND THROWING DICE. Show each step and check each answer.
Lesson Keywords
- Coin – A flat, usually round piece of metal with specific markings used for currency or games.
- Die – A small cube with faces marked with spots from 1 to 6, used in games of chance.
- Head – One side of a coin, usually featuring a person’s head.
- Tail – The opposite side of a coin to the head.
- Outcome – A possible result of an experiment or event.
- Tally – A mark used to record counts, often grouped in fives.
- Chance Event – An event whose outcome is uncertain or random.
- Probability – The likelihood of an event occurring.
Differentiation
For pupils who grasp concepts quickly, the teacher can provide additional quantitative aptitude problems involving slightly more complex scenarios or ask them to predict outcomes for a larger number of trials. For pupils who need more support, the teacher can provide pre-drawn tally chart templates, offer one-on-one guidance during practical activities, and simplify the quantitative aptitude problems to focus on identifying favourable and total outcomes.
Note for teachers using this lesson plan
Ensure each pupil or group has access to a coin and a die for the practical activities. Emphasize the importance of accurate recording and tallying. Encourage pupils to discuss their findings and observe patterns, even if not explicitly calculating advanced probabilities. The quantitative aptitude section should be kept simple and focused on conceptual understanding for Primary 5 pupils.


Community Join the conversation Open discussion +